Vizable Insights is a trusted partner of leading brands:
Tableau data visualization. It's what we do.
At Vizable Insights, we transform raw data into compelling narratives, empowering businesses to make informed decisions. With a decade of unparalleled experience in Tableau data visualization solutions, we bring expertise, innovation, and a passion for turning complexity into clarity.
We blend analytical integrity with an engaging design. Our data visualization solutions will make it easier for your team to uncover important insights.
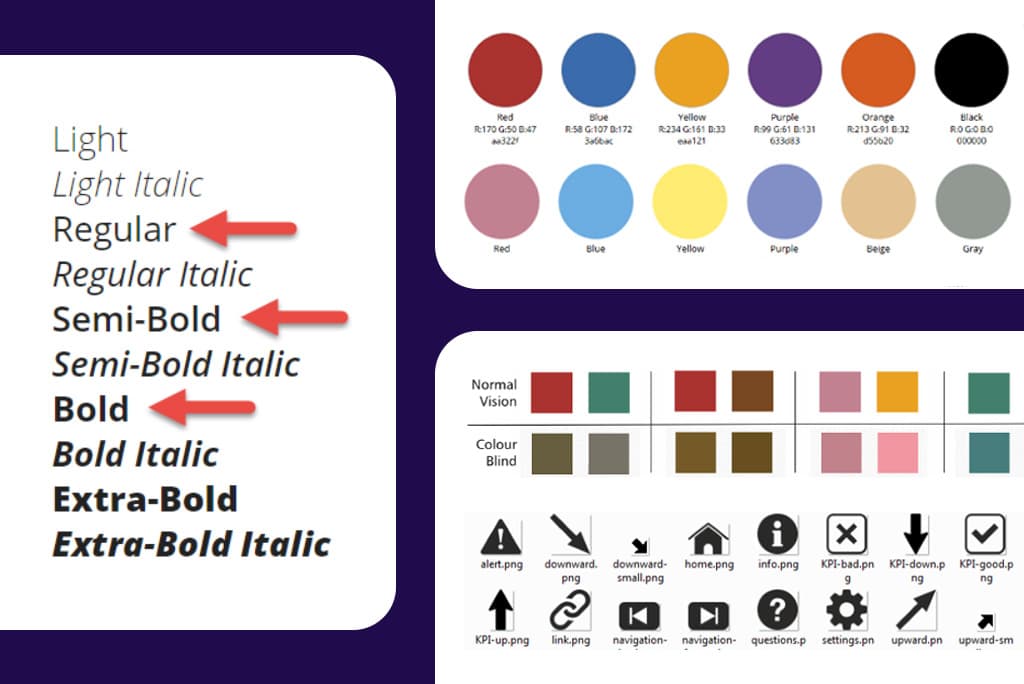
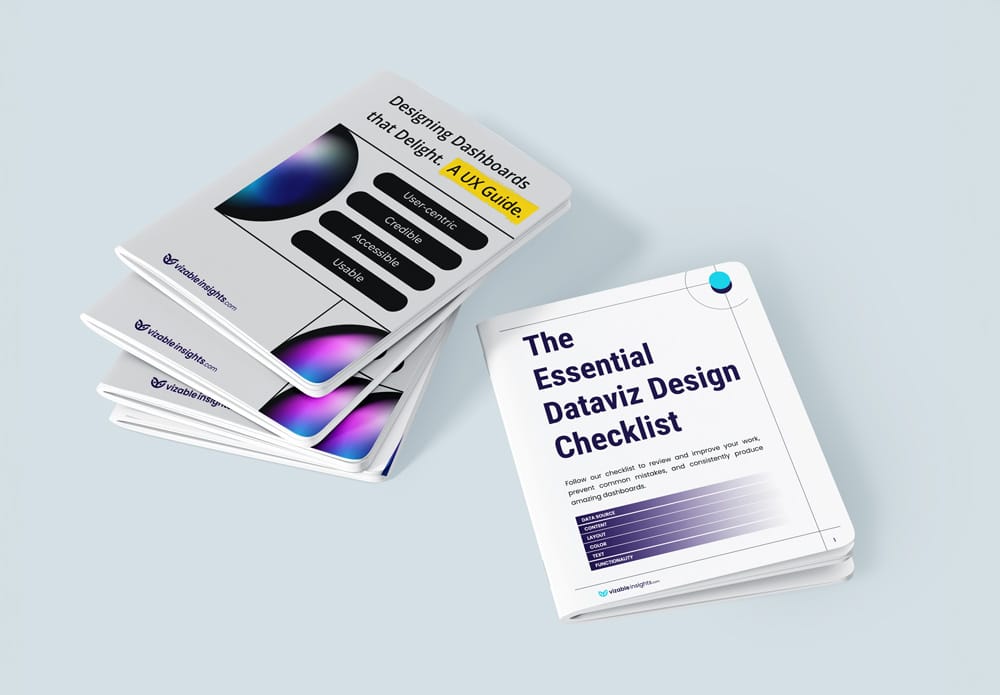
Enhance your dataviz practice with a style guide tailored to your brand.
Our Track Record.
1+
Years serving clients on 5 continents.
100+
Number of projects completed.
10%
Client satisfaction rate.
Data analytics meets engaging design.
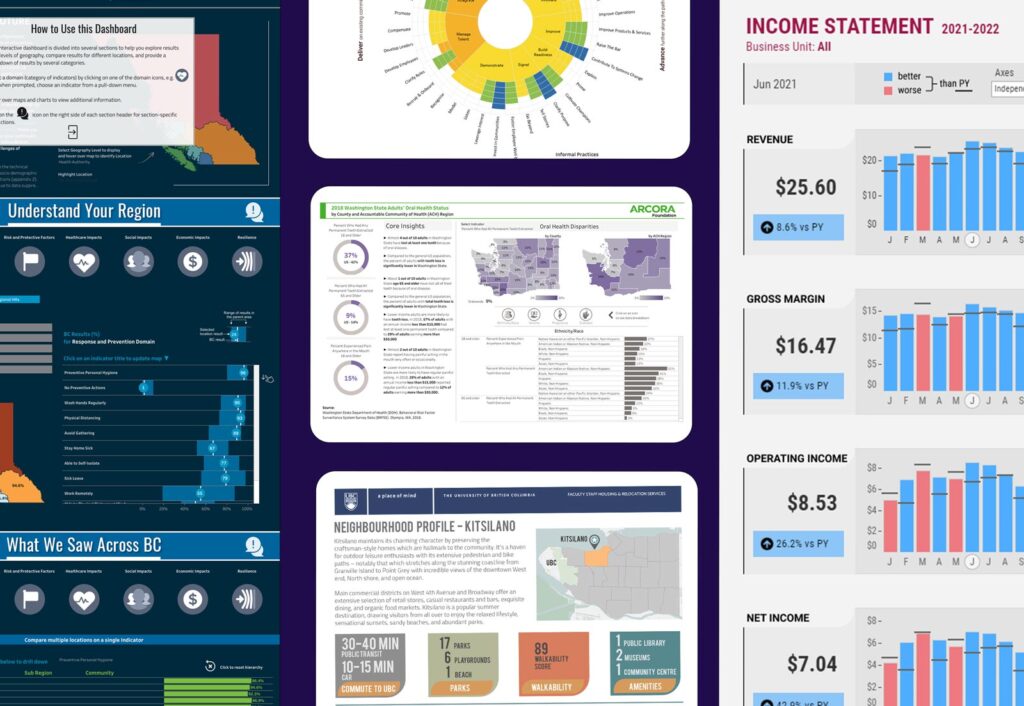
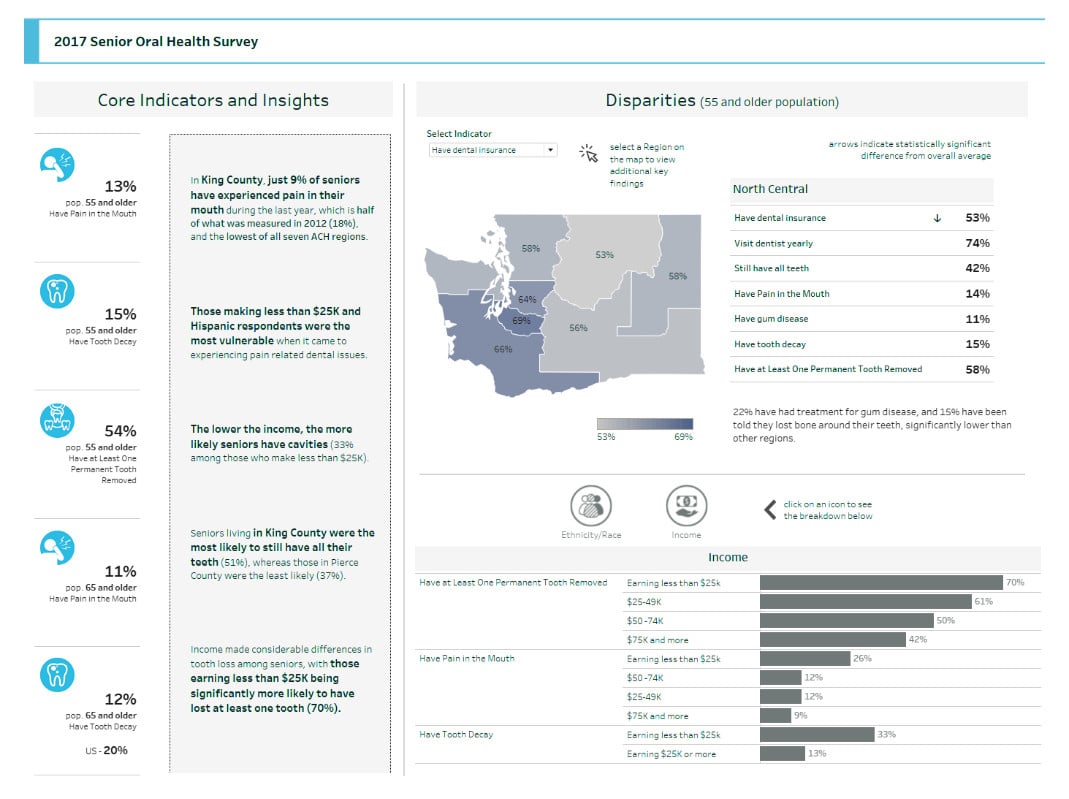
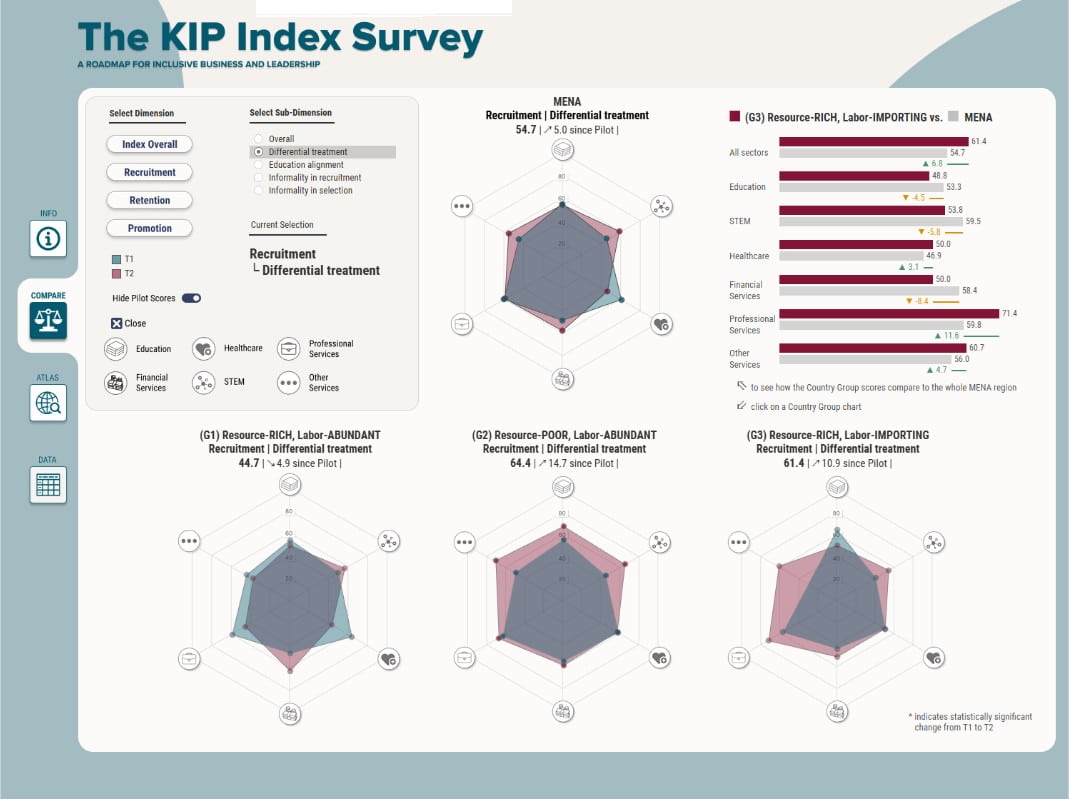
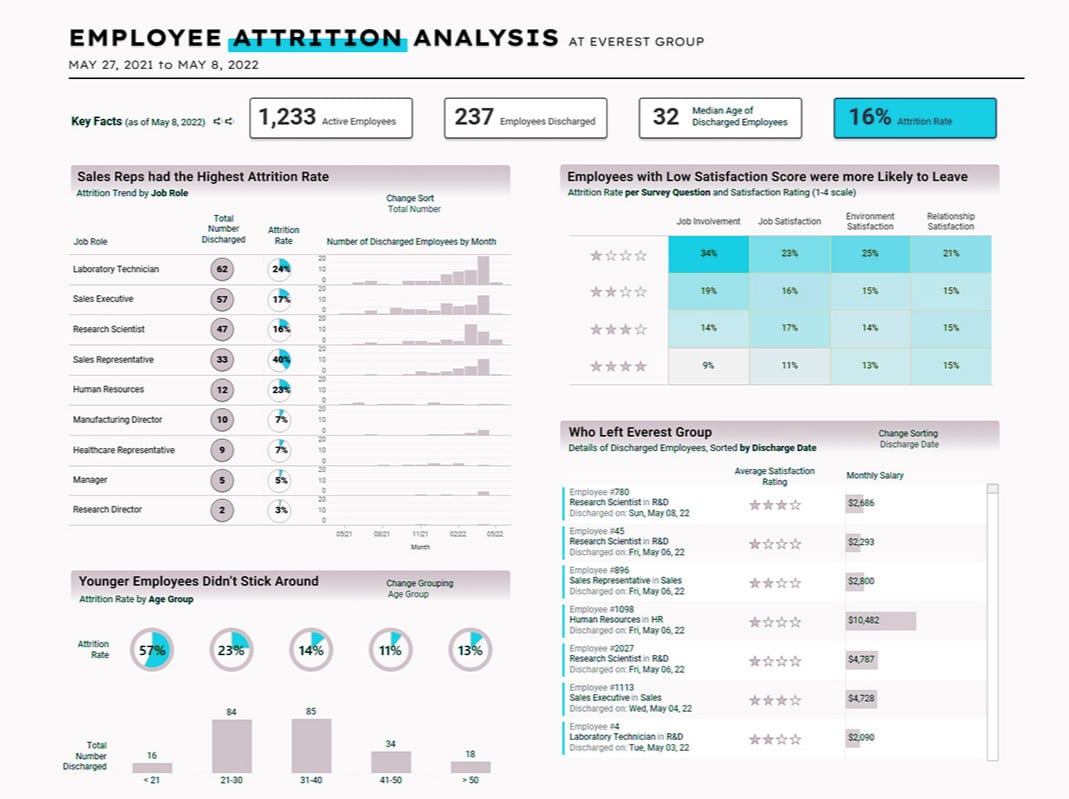
Our meticulously crafted industry-specific Tableau dashboards are thoughtfully designed to address your specific needs, delivering the genuine value hidden within your data.
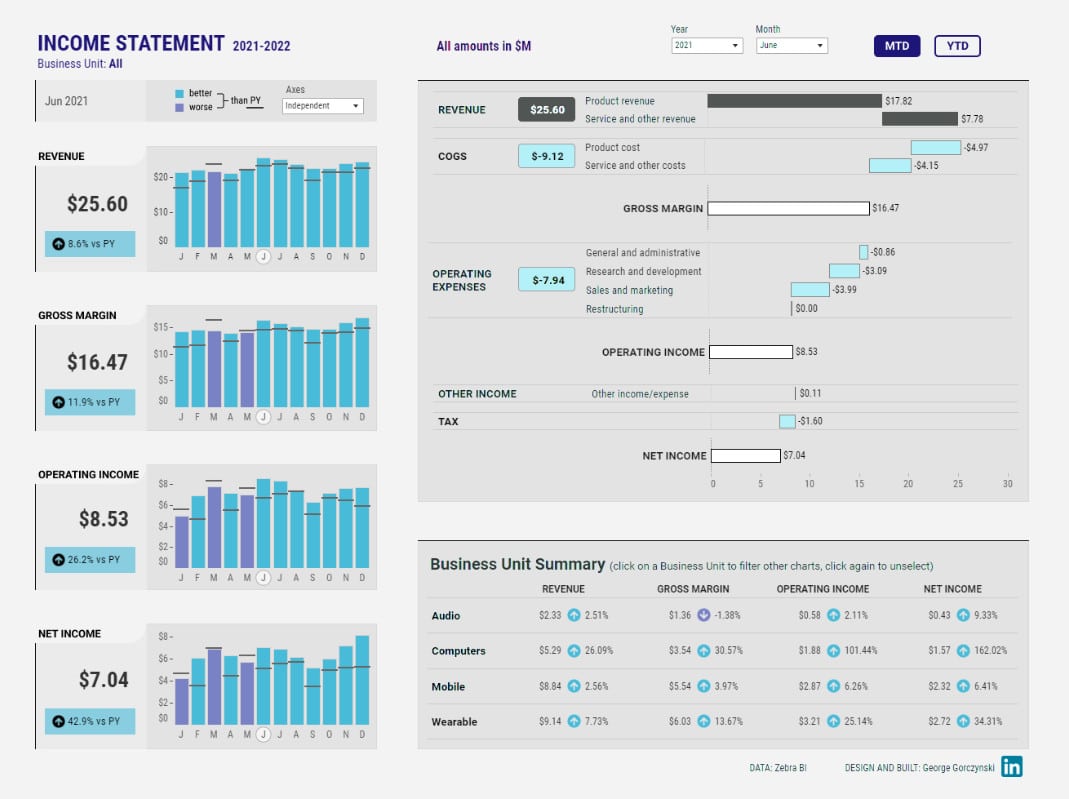
Track cashflow dynamics, & accounts receivable/payable, with clarity.
"Vizable Insights helped us work through the right data architecture and designed wonderful visualizations."
Stephanie Bertels
Founder of Embedding Project
"Vizable Insights will transform your data, add value at each phase of your project & rapidly improve your Tableau skills. They are brilliant at structuring data for optimal reporting and creating dashboards with exceptional visual appeal and usability."
Alia Katabi
Evaluation & Data Analyst at Delta Dental of Washington
"They can turn your data into a compelling story through a well-designed, user-friendly dashboard. Vizable Insights was instrumental in translating the KIP index into a user-friendly dashboard offering invaluable insights and recommendations."
Charlotte Karam
Endowed Professor at the University of Ottawa
"George is wicked-smart, humble, and dependable. His work is on-time, on-budget, and always exceeds my expectations."
Rick Anderson
Director of Public Policy at Washington Nonprofits
"George is a problem solver and a creative thinker, and used these talents to develop high quality Tableau and graphic design products. I recommend his services to those who are looking for a reliable, knowledgeable, & results-oriented Tableau consultant."
Sophia Redmond
Assoc. Director, Strategy & Decision Support at the University of BC
"Vizable Insights played a pivotal role in the development and implementation of our Business Intelligence platform. George’s blend of domain knowledge, technical proficiency, and congeniality makes him a rare find in the industry."
Tech Entrepreneur
AI Executive, Confidential Project
"Vizable Insights delivered exceptional data visualization solutions and Tableau training for Post Holdings. They exceeded our expectations by not only delivering elegant and effective Tableau dashboards, but also contributing to the development of a better data culture at Post Holdings."
Lance Trudell
Director, Decision Science at Post Holdings
"George has the unique combination of technical expertise, artistic imagination and excellent customer service skills."
James Hodkinson
Global Head of Data and Analytics at Dyson
"Vizable Insights’ creative and analytical approach to our project were key factors in our success. George applied his technical skills in conjunction with his thoughtful, well organized style to help us deliver a dashboard that exceeded our expectations."
Kate Bailey
Managing Director at Alberta Real Estate Association
We’ll start with a free consultation to understand your needs and objectives and assess whether we are a good fit to help you. If we are, we’ll put together a proposal outlining the scope, timeline, and cost. Once agreed, we start our work with a detailed plan.
How do you price your Tableau consulting services?
Our Tableau Consulting services are priced on a project, daily or hourly basis. After our initial discussion, we will quote you the cost of the whole project. We are good at estimating the cost and we will stick to our quote, unless the scope of the project changes. For longer term engagements we offer hourly or daily models.
What is the typical timeline for a visualization project?
Project timelines vary based on complexity of the project and availability of the data. A basic Tableau dashboard could take a few days while more complex projects might take several weeks or months. We will provide a detailed timeline after understanding your specific needs.
We have a major deliverable & are short-staffed. Can you help us?
Based on availability, we can augment your team to help on a critical project. Whether you need to solve a tough Tableau problem or give your dashboards a design boost, we can help.
How do you tailor your services to different industries?
We work with clients in industries as diverse as healthcare, banking or technology, and we understand that each industry has unique data and visualization needs. Our approach is to understand your industry-specific challenges and goals, and translate your business requirements into custom Tableau solutions that align with these requirements.
Who is your typical client?
We work with organizations ranging from small non-profits to large corporations.
Do you work exclusively with Tableau platform?
Tableau is our tool of choice to create exceptional business dashboards. But we also worked with clients for whom we designed and manually created charts and visuals for inclusion in their reports and printed materials.
Can you help us organize our data?
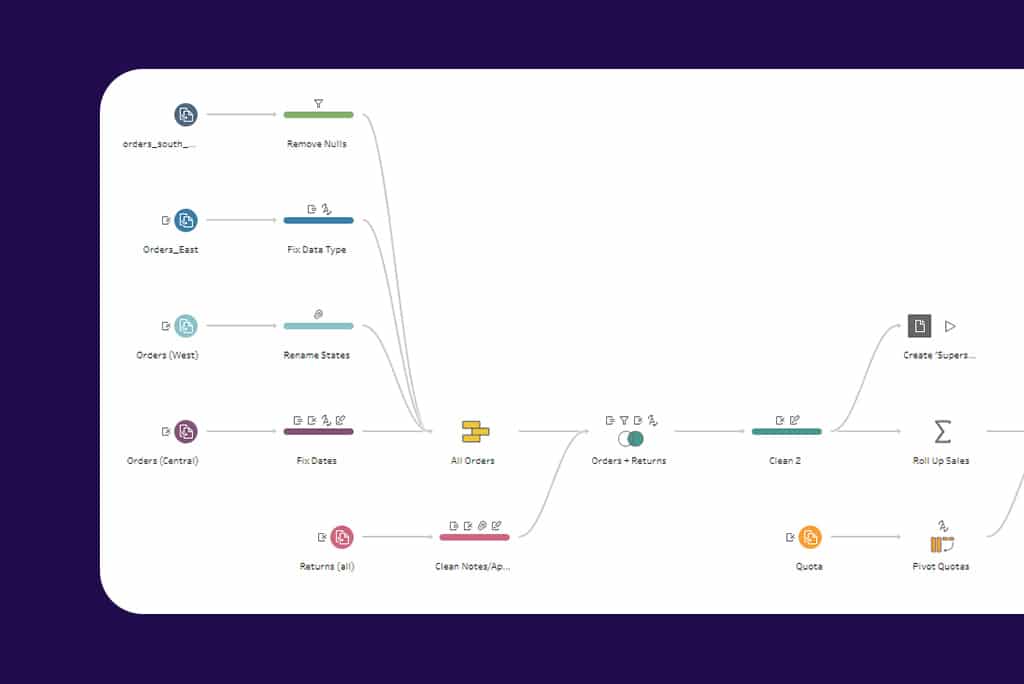
Absolutely! If your data lives in multiple Excel spreadsheets, text files or PDFs, we will expertly combine them and create a data model that is optimized for Tableau and easy to update down the road with new data.