Challenge
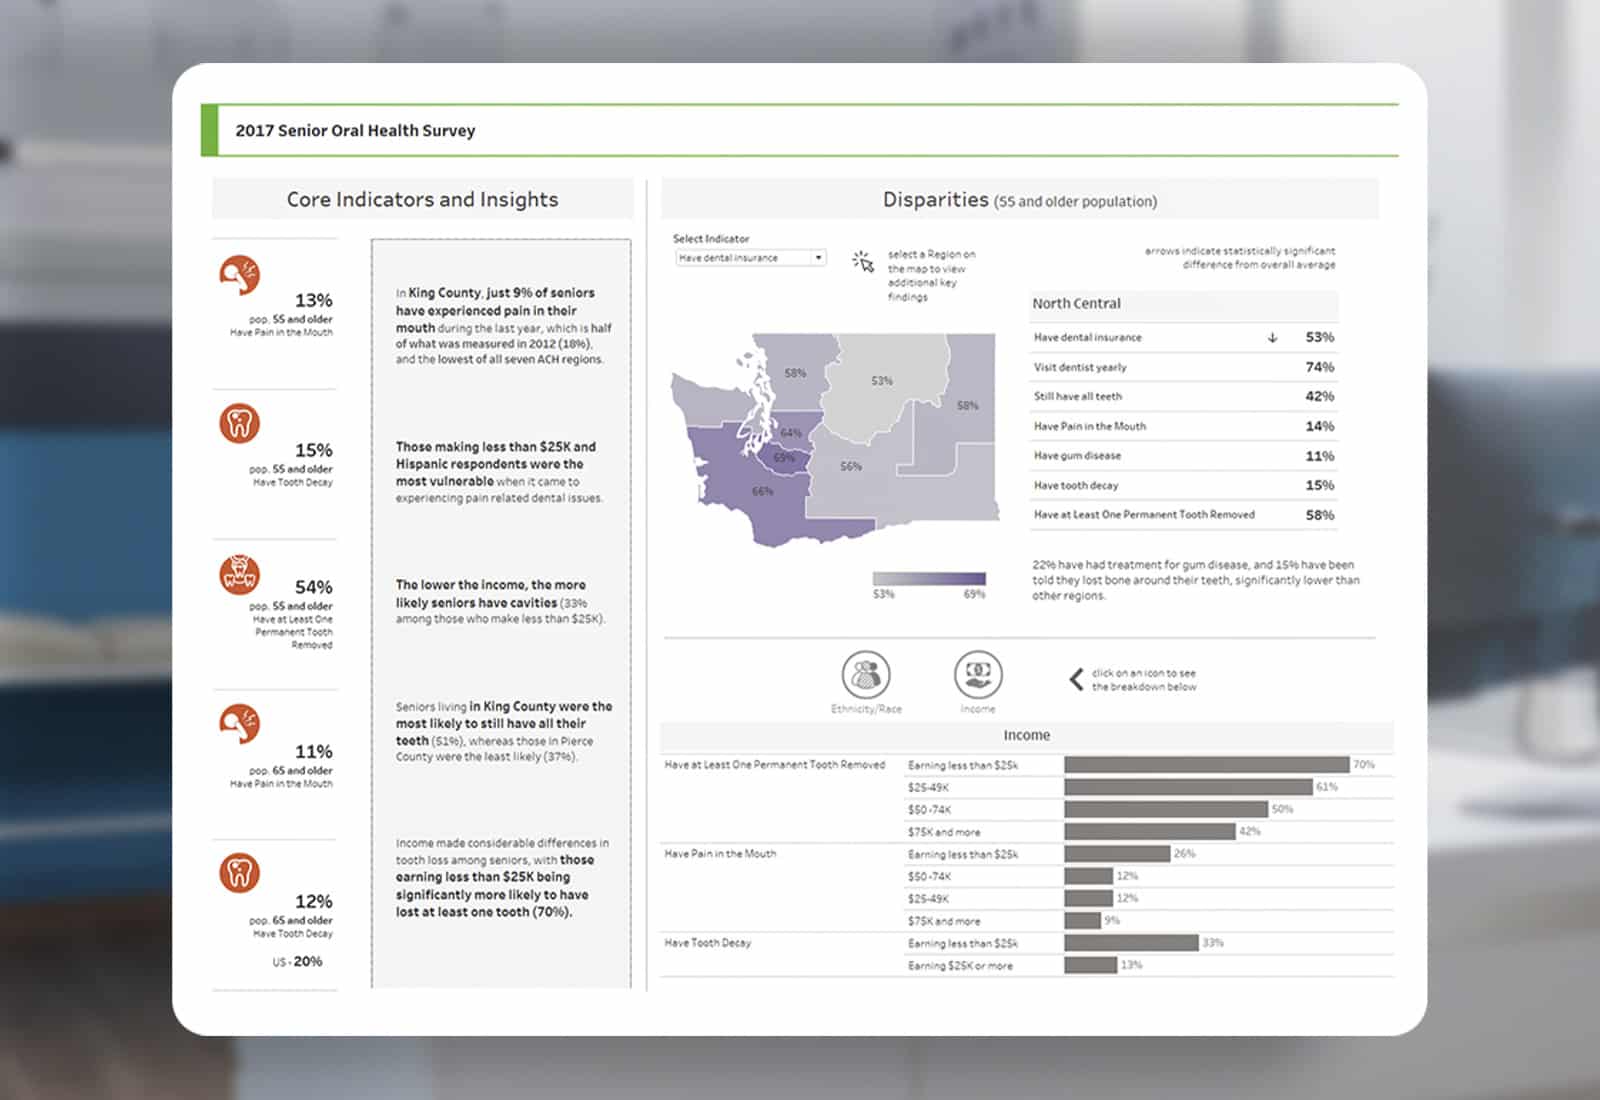
A multinational public health agency required a set of data visualizations to fulfill its objective of assessing risks and describing the status of the public’s health along the disease spectrum. They turned to Vizable Insights for help.
Solution
The data covered incidence of multiple diseases and doctor and hospital admissions for multiple countries over the last 20 years. This required conducting several discovery sessions with the client’s stakeholders to understand the data and fine tune the detailed goals of the project. We connected Tableau to multiple data sources stored in a PostgreSQL database and developed a set of dashboards. Our visualizations provided the client with a comprehensive overview of historical and current public health status and also equipped them with a tool to monitor the effectiveness of future interventions. In addition to delivering over 30 dashboards, we prepared design documentation outlining the structure of data sources, logic behind our design and development decisions, as well as detailed descriptions of all calculated fields, sets, groups and actions. We also provided the client’s staff with training necessary to take over and maintain the visualizations in-house.